
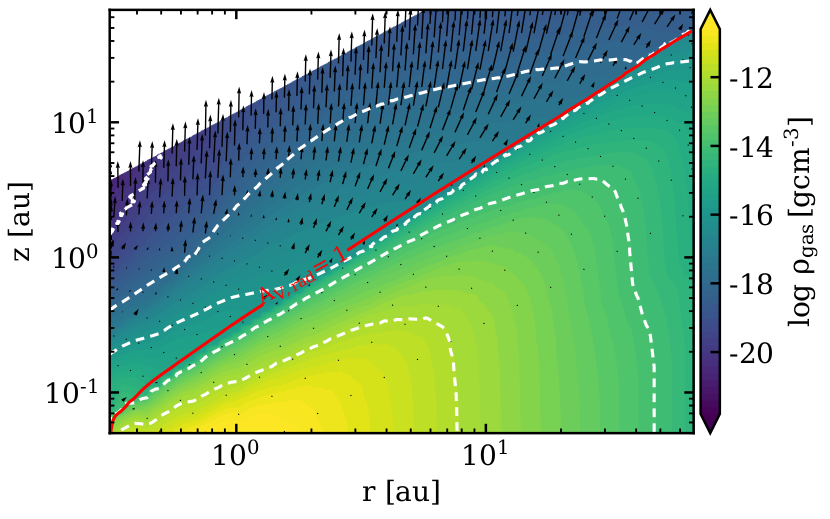
We use hydrodynamic photoevaporative disk-wind models and post-process them with ProDiMo to produce synthetic observables for the spectral lines o−H2 1−0 S(1) at 2.12 μm and [OI] at 0.63 μm and directly compare the results to a sample of observations. The figure shows a two-dimensional disk and wind gas density structure with velocity field (black arrows). The red solid contour shows where the radial visual extinction AV,rad is equal to unity (the disk surface). The white dashed contours correspond to the density values shown in the colour bar. See Rab+2022 (A&A 668, 21) for details.