
Abundant Hydrocarbons
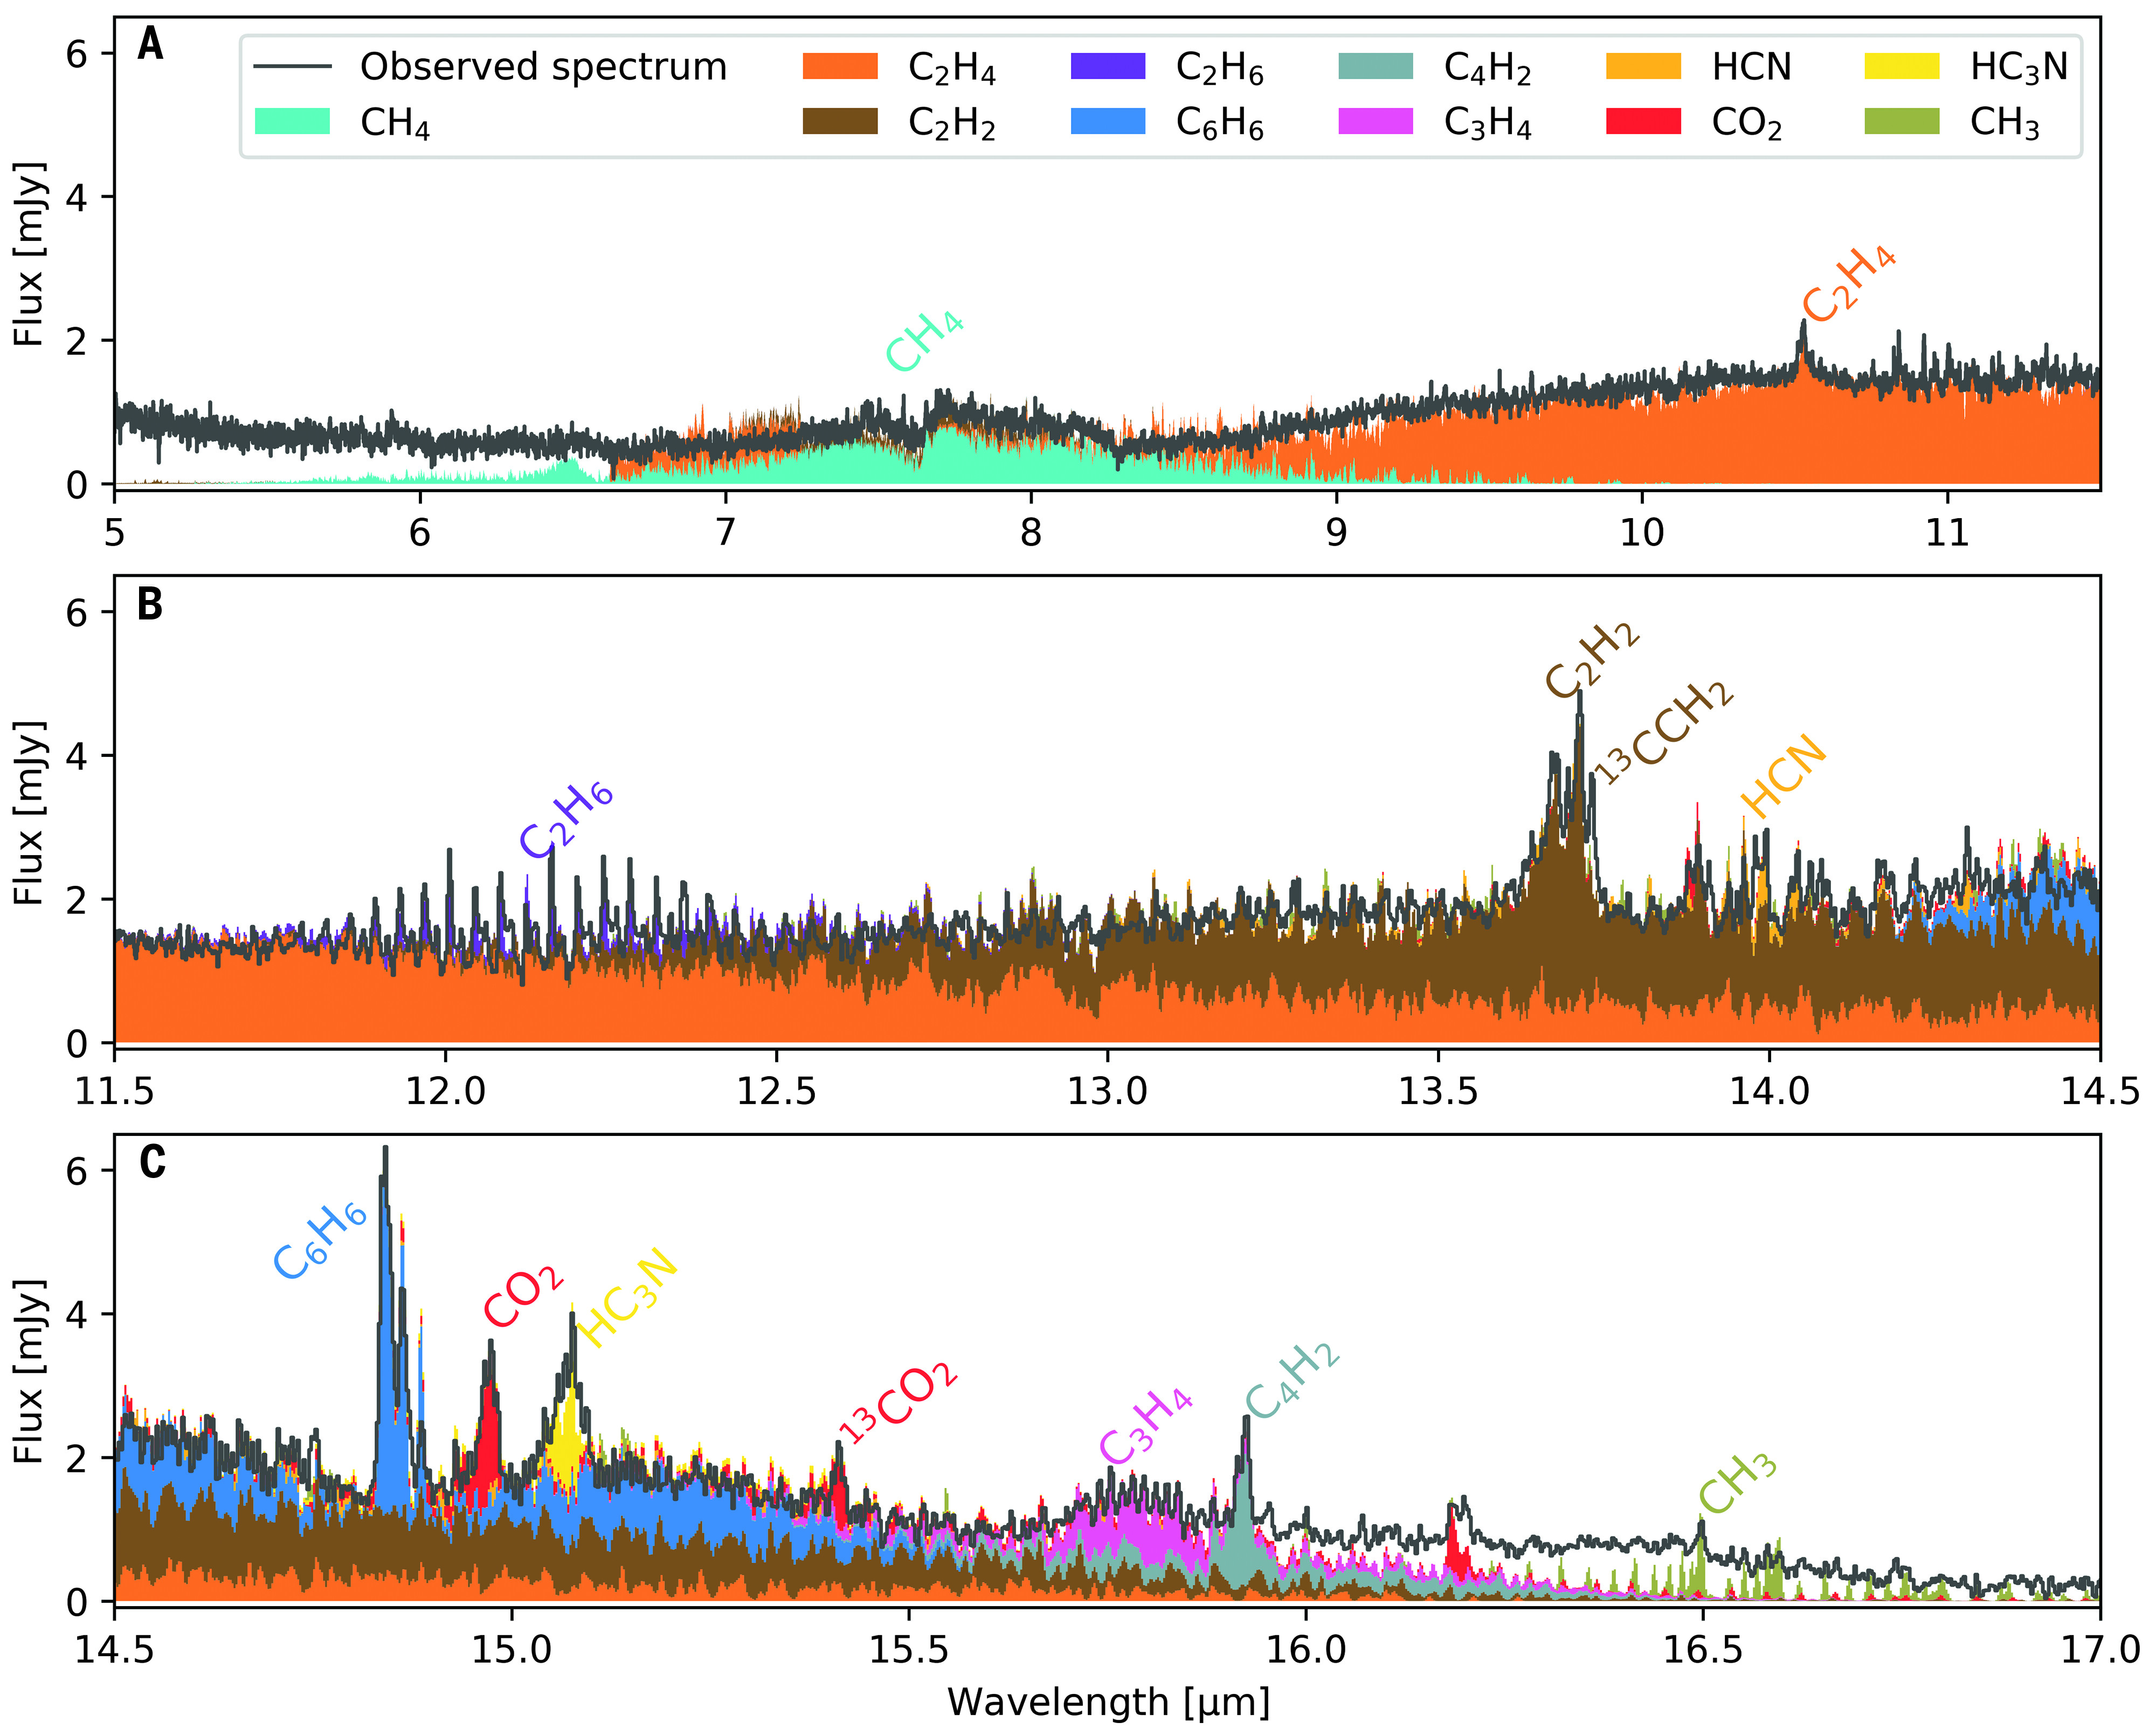
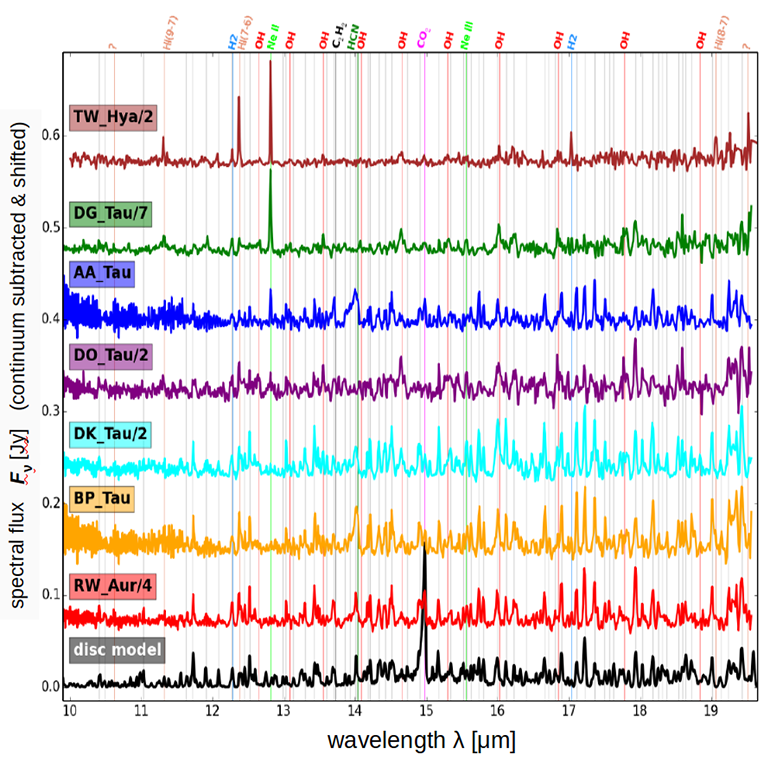
Using the zero-dimensional LTE SLAB-models that are part of ProDi...
Read more
CAI formation in the early Solar Nebula
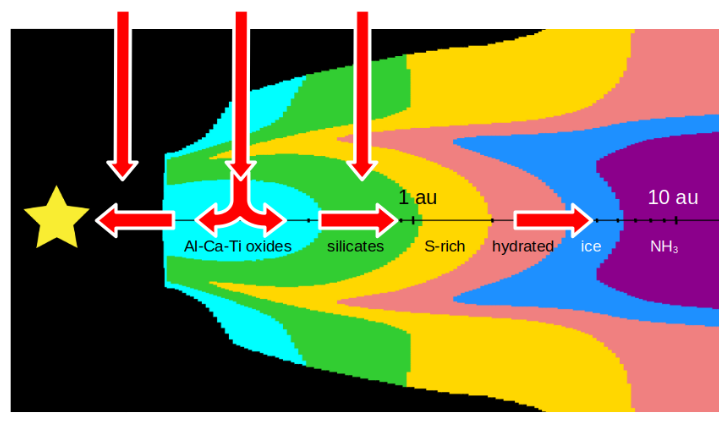
  This paper proposes a pathway to form mm-sized, pure, and...
Read more
Fitting the EX Lupi JWST line & continuum spectrum with ProDiMo
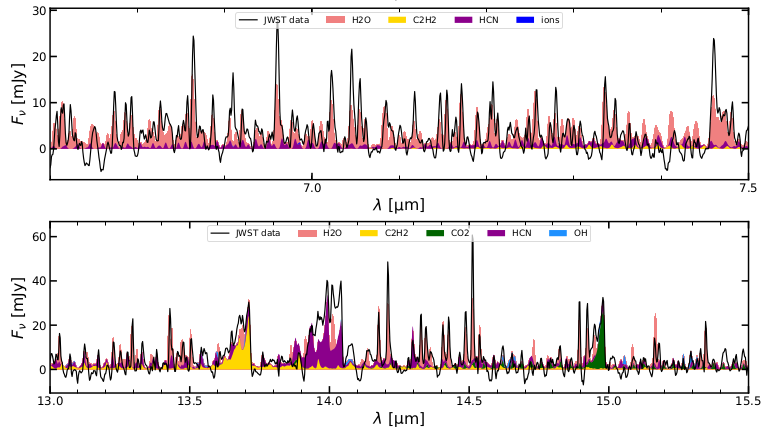
Based on an improved ProDiMo version, we developed a disc model f...
Read more
ALMA gaps
ALMA gaps
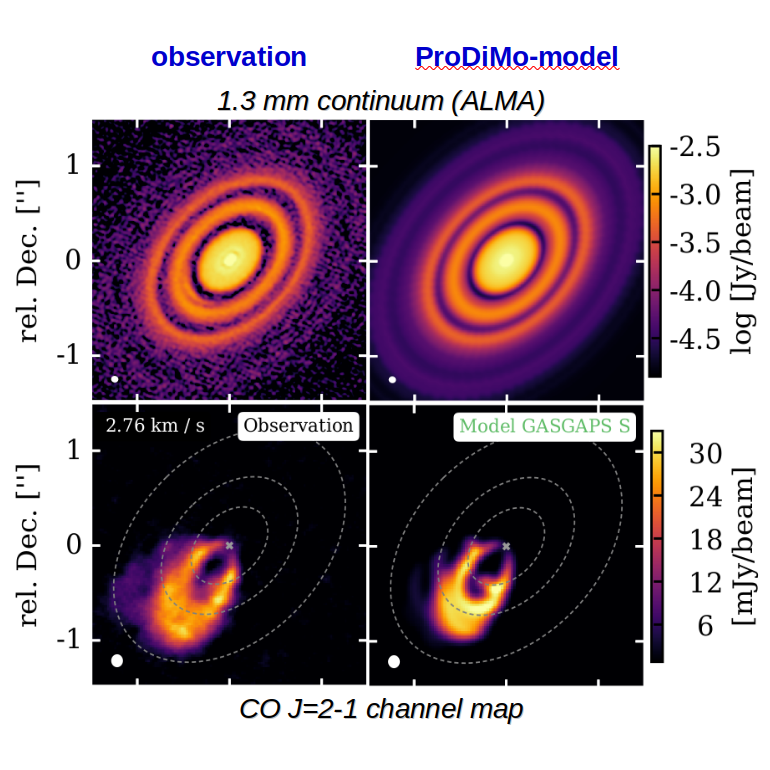
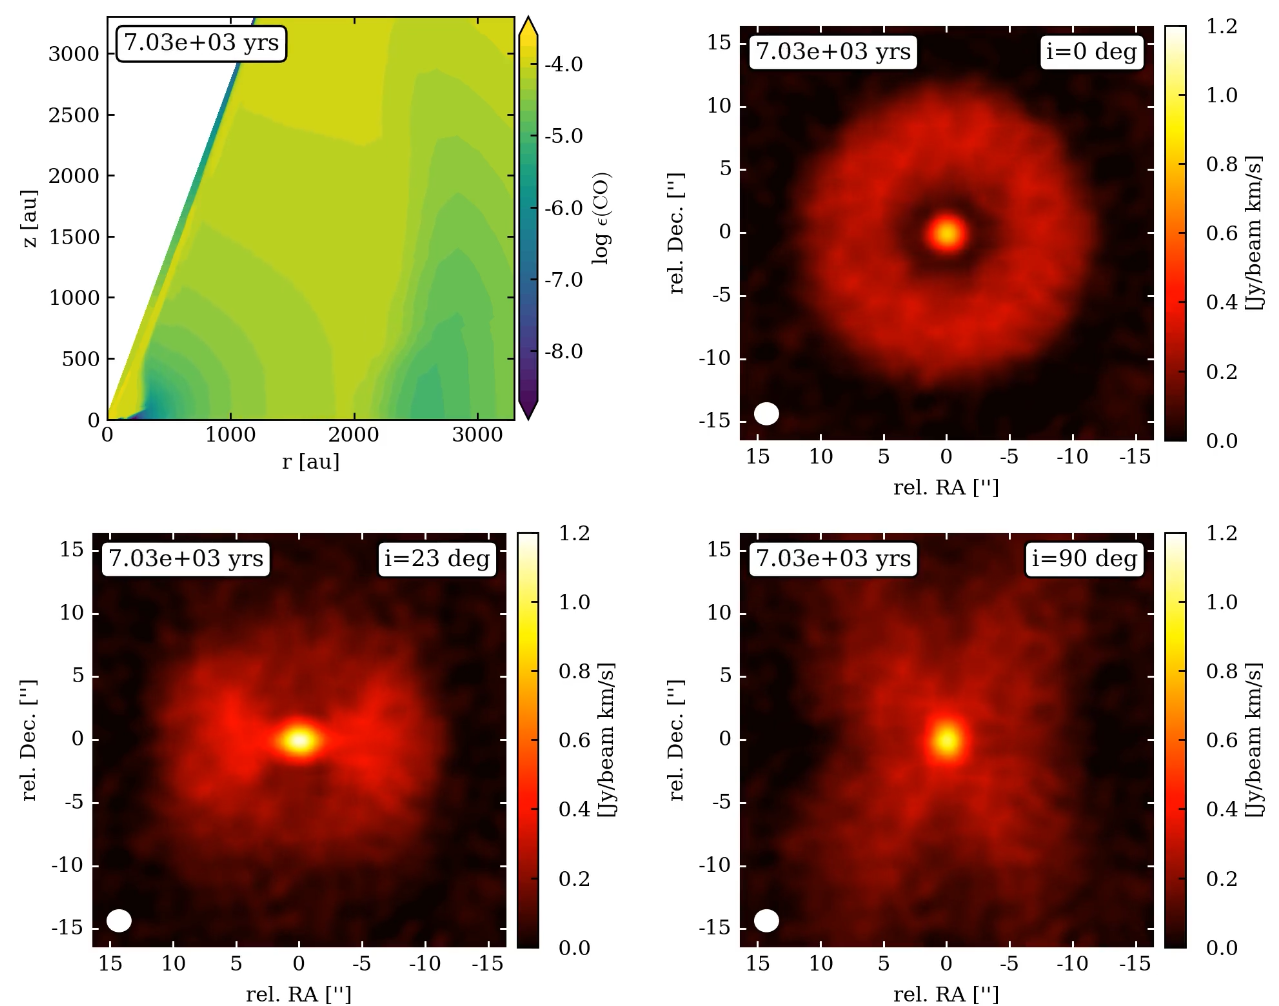
ProDiMo can predict continuum images and molecular line channel m...
Read more
ice absorption
ice absorption
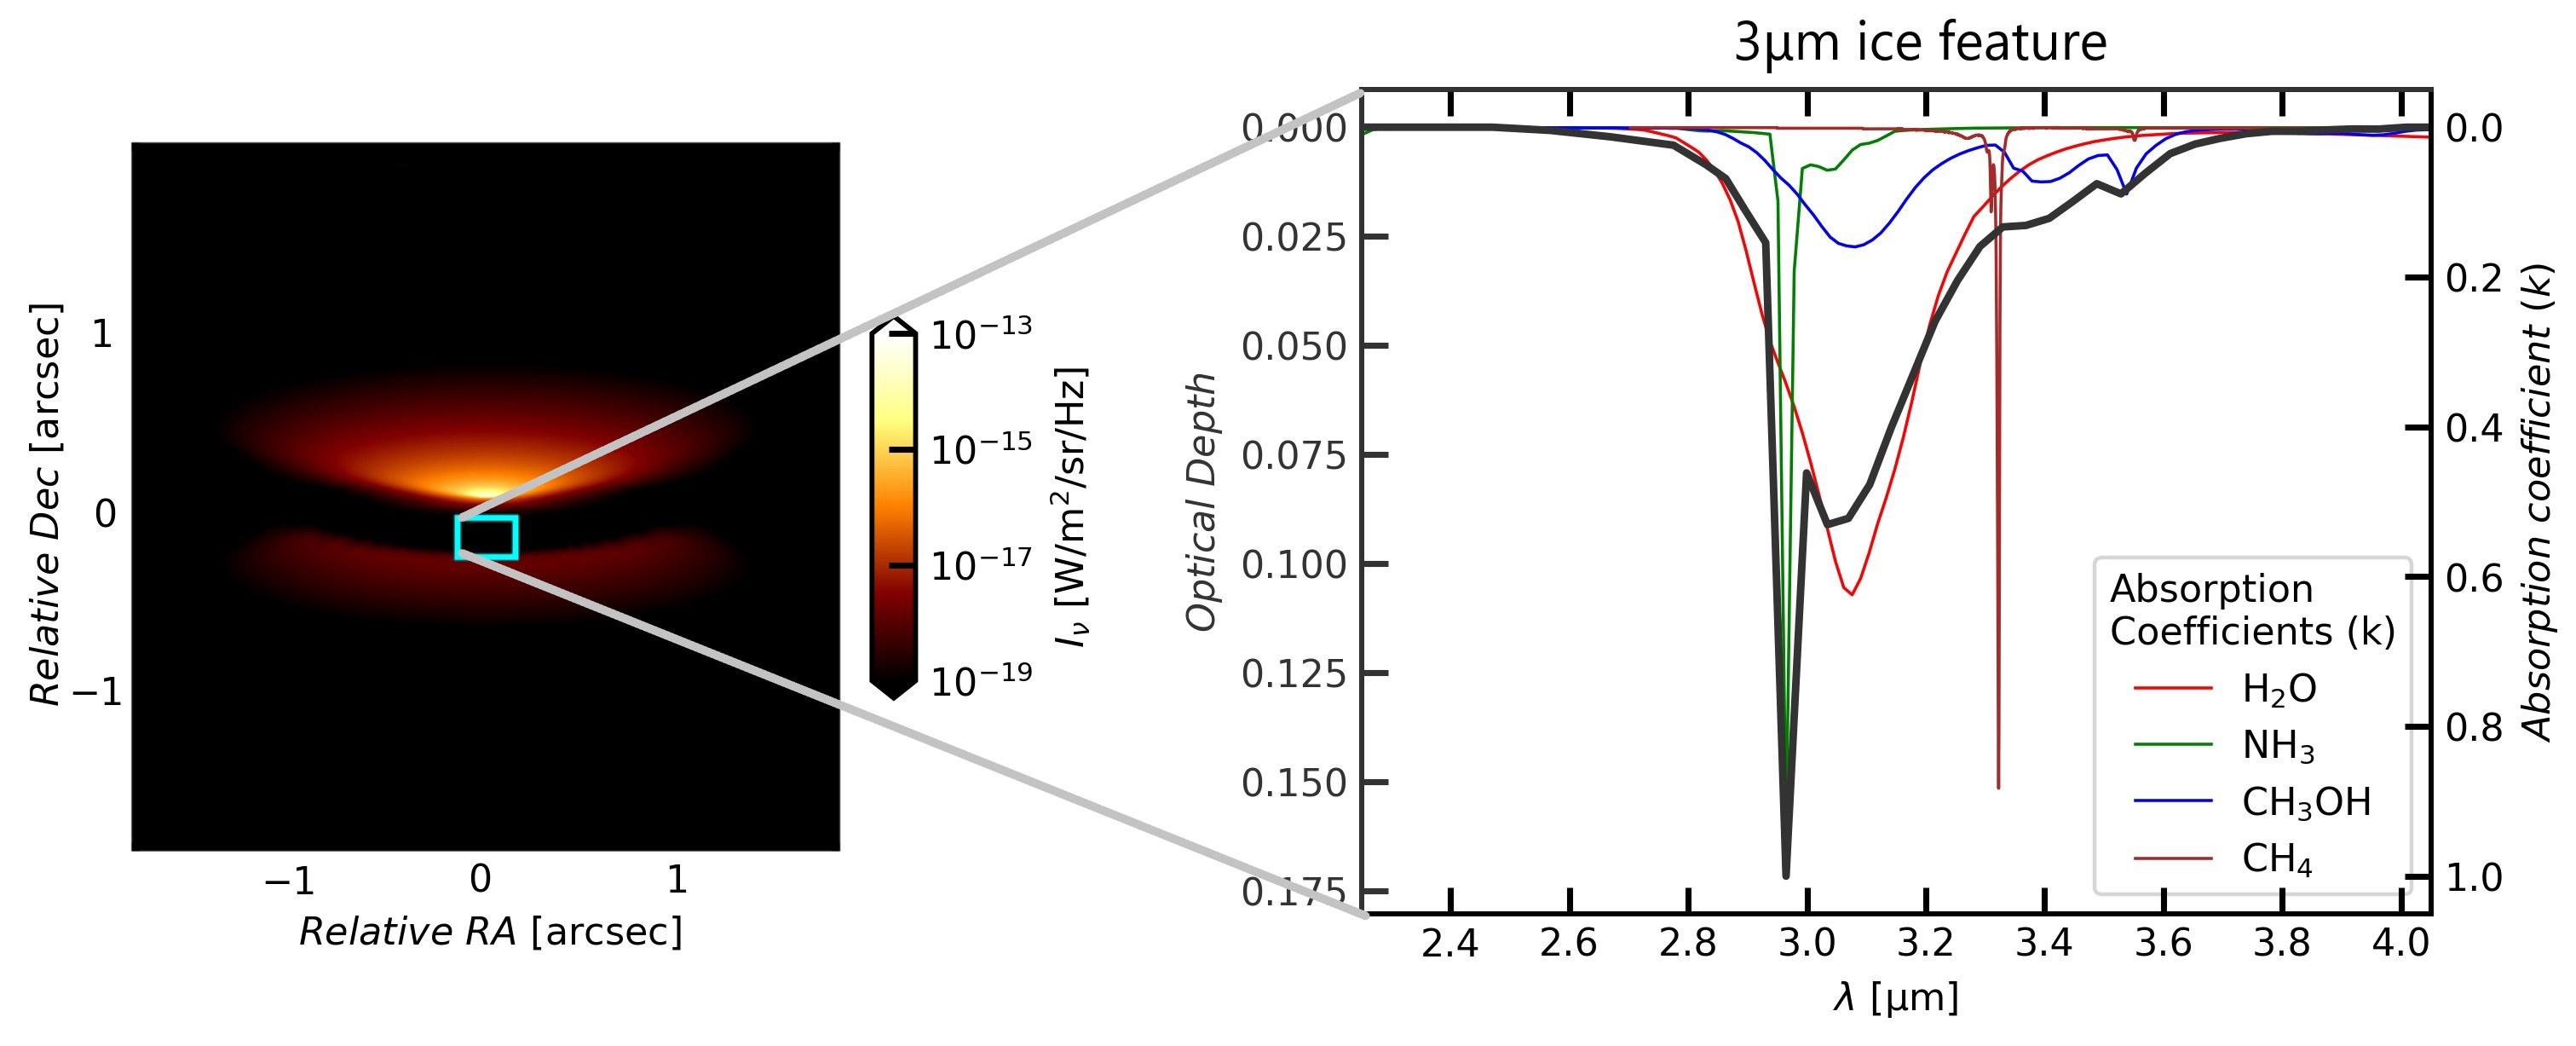
One of the latest developments of ProDiMo is to include ice opaci...
Read more
Disk winds
Disk winds
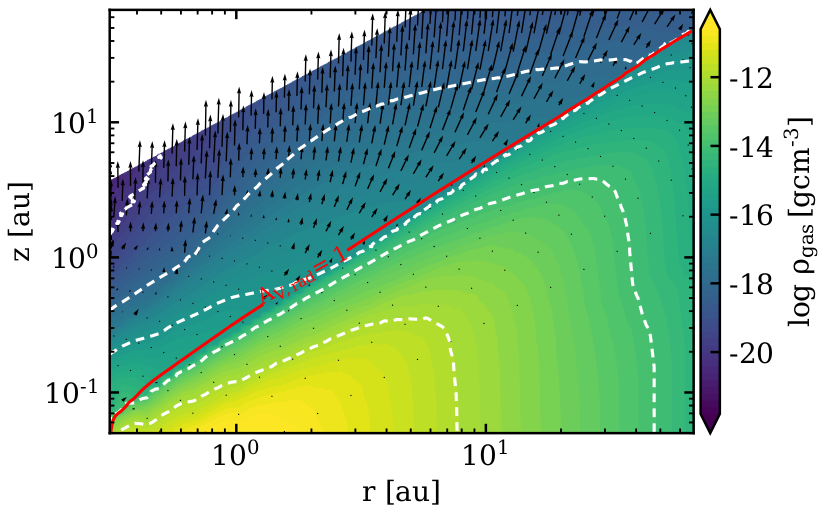
We use hydrodynamic photoevaporative disk-wind models and post-pr...
Read more
Chemical processes
Chemical processes
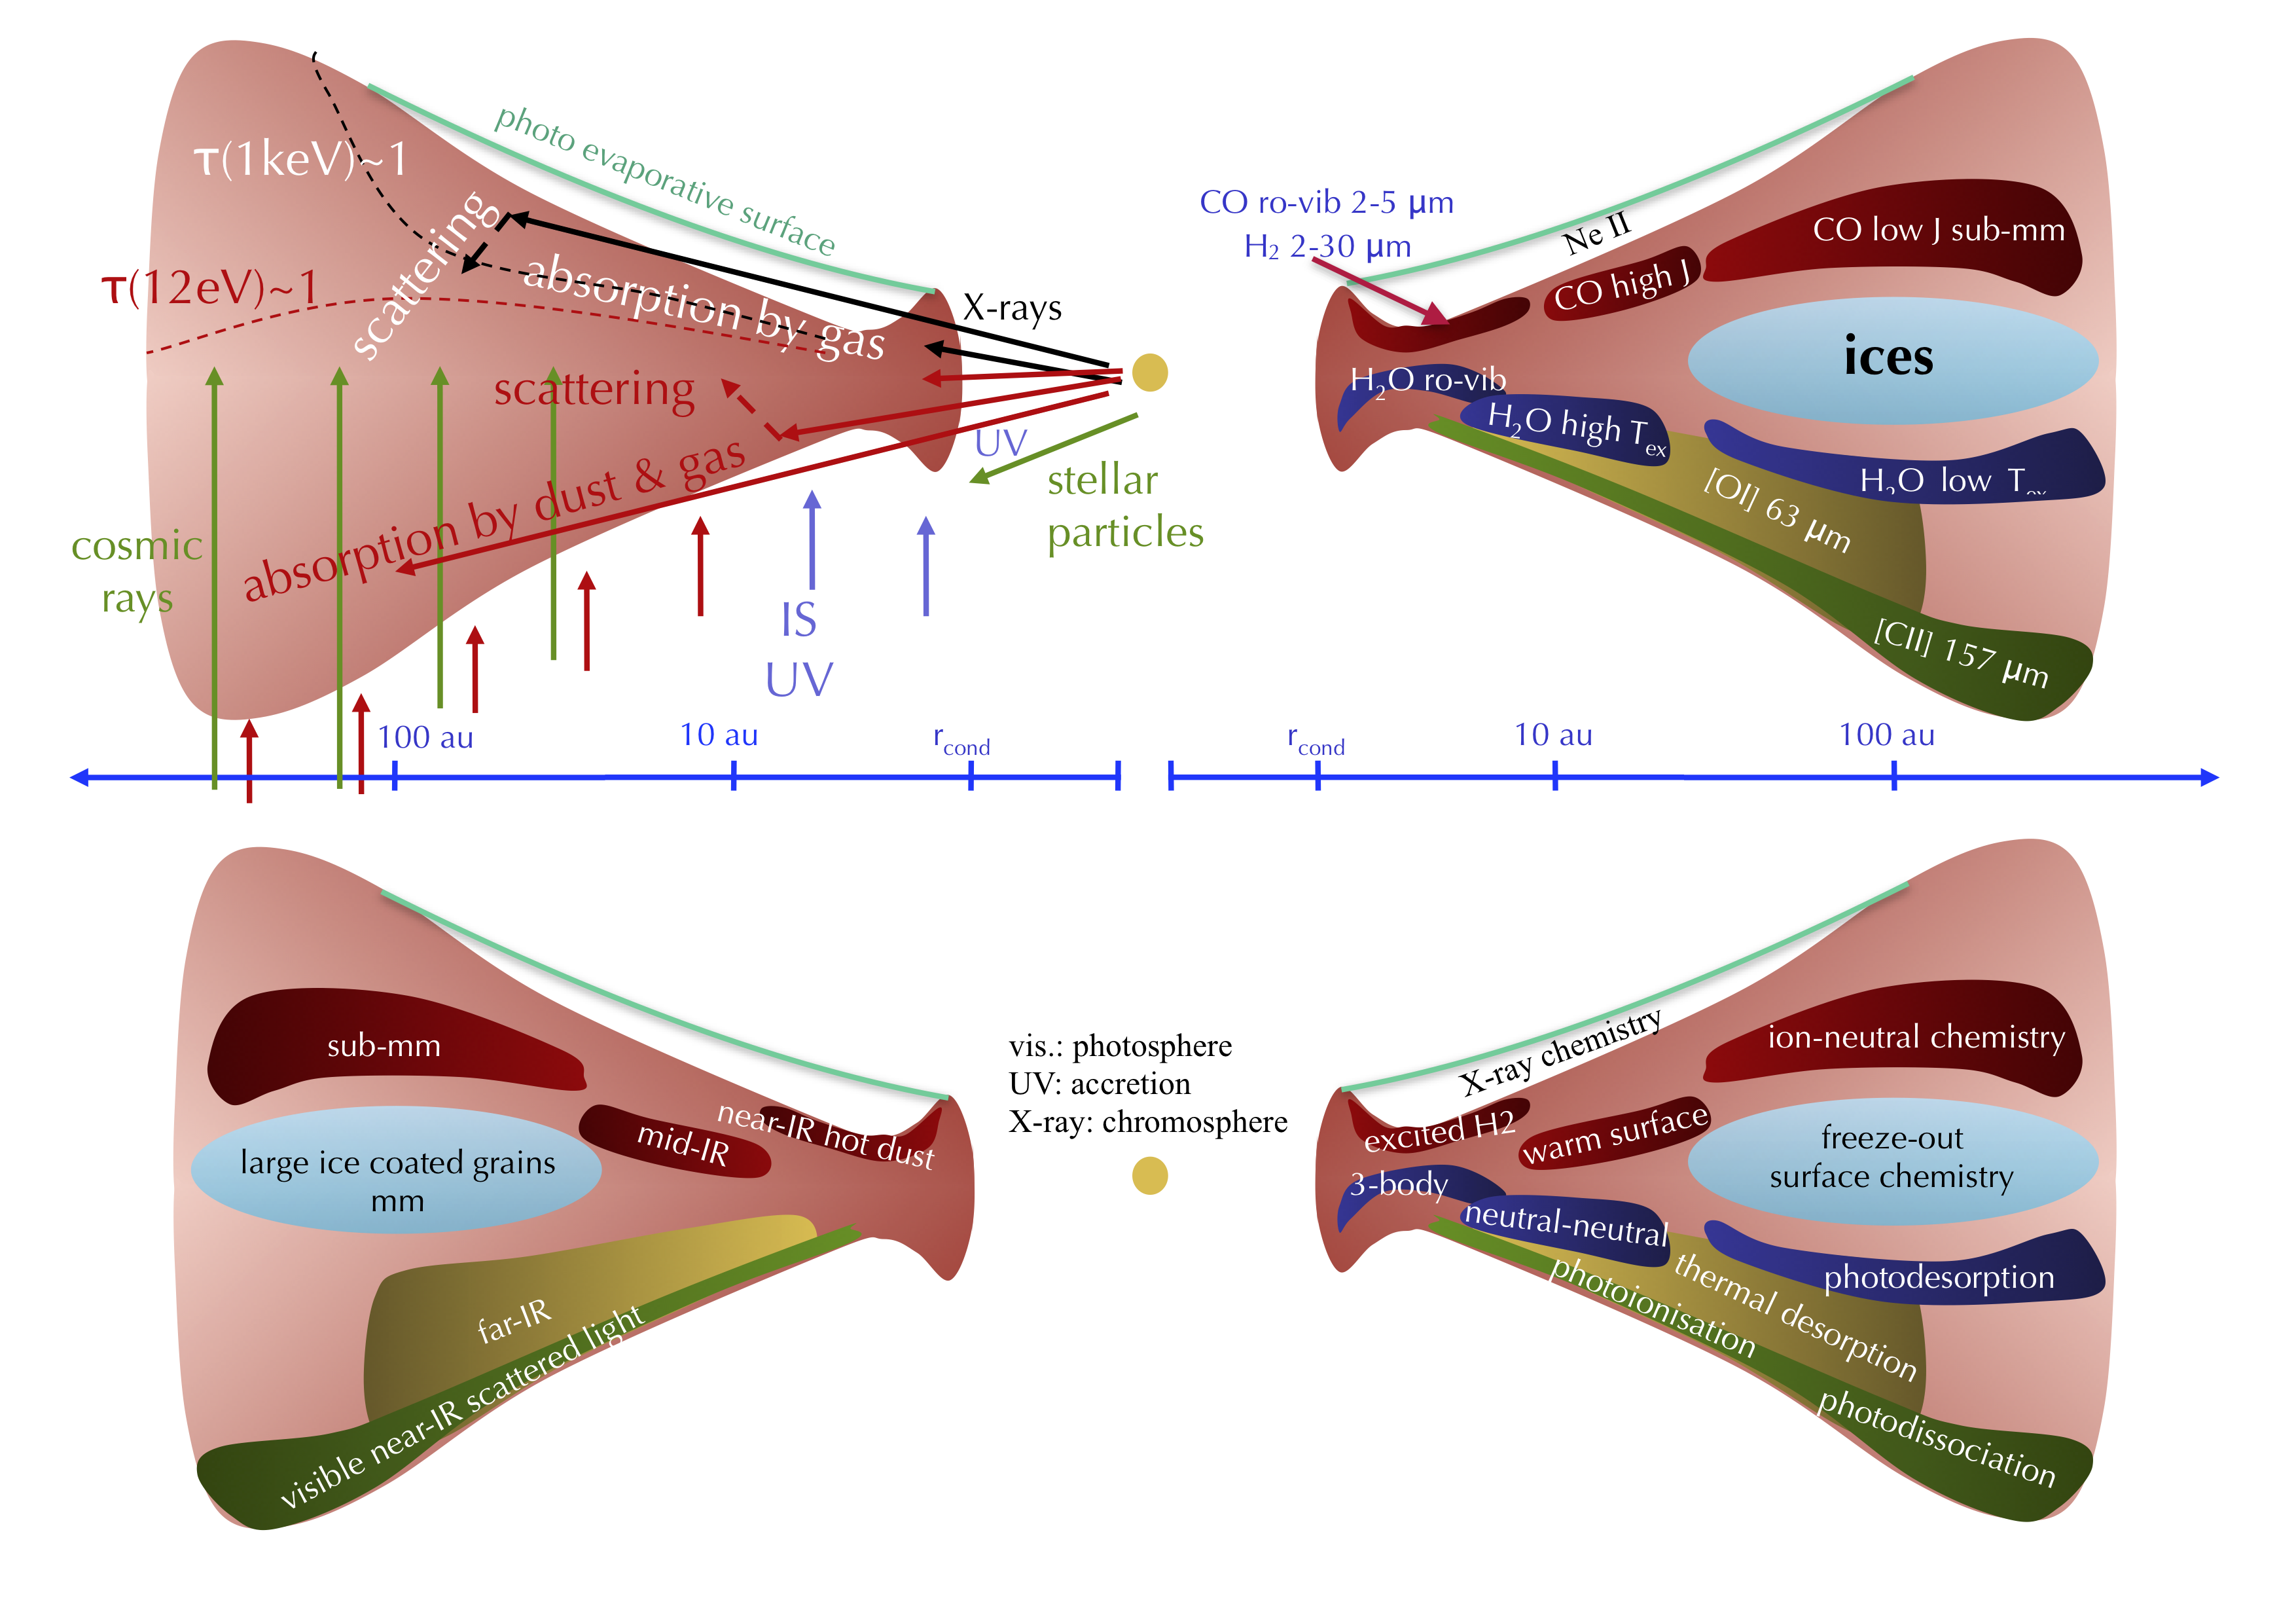
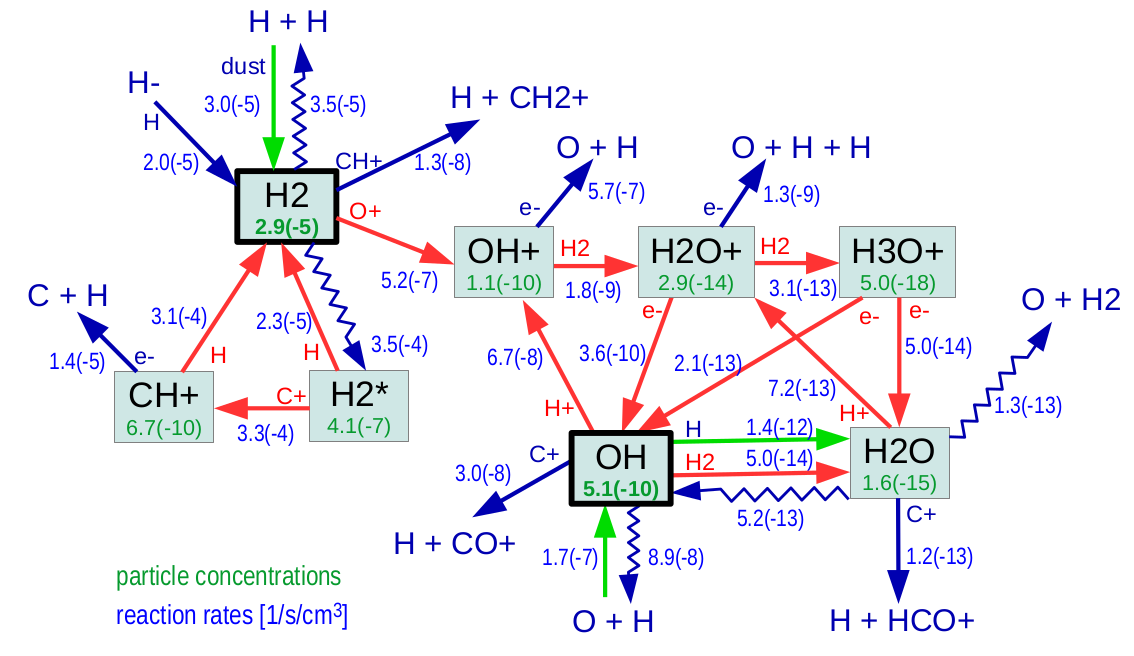
ProDiMo's goal is to model the chemistry and heating/cooling bala...
Read more
Heating and Cooling
Heating and Cooling
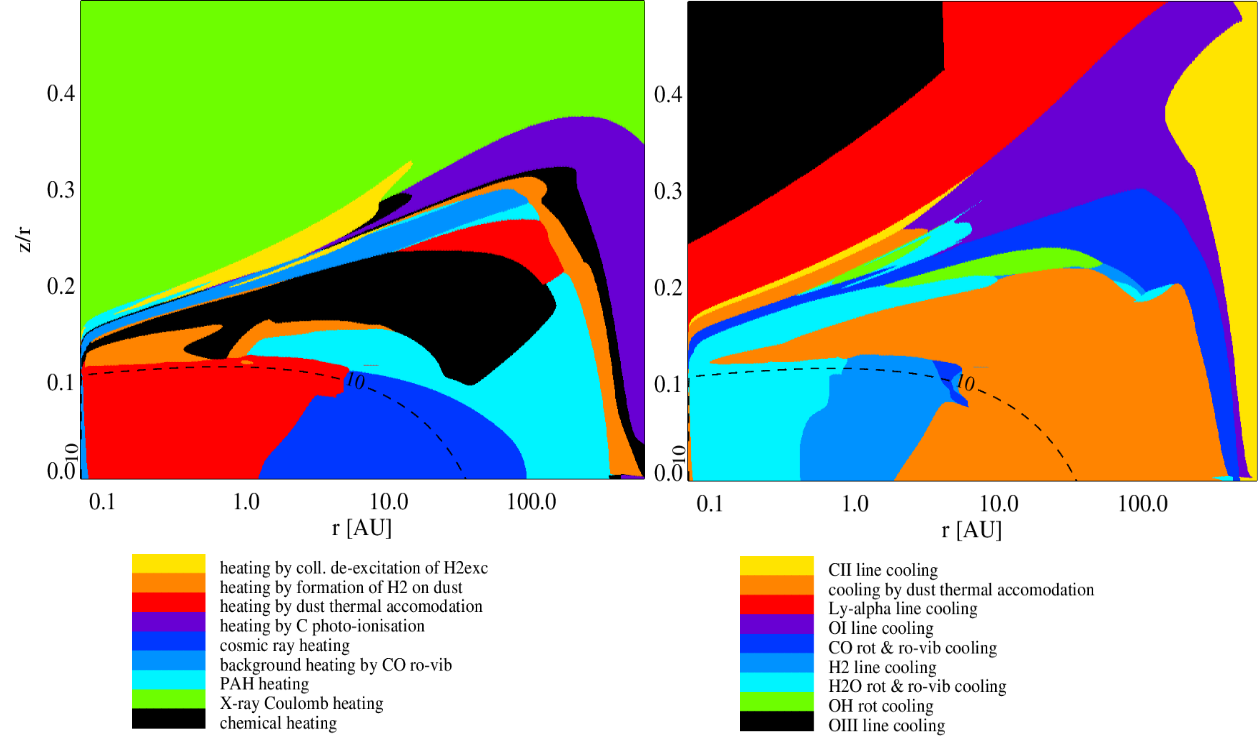
At each point in the disk, ProDiMo solves the gas heating and coo...
Read more
surface chemistry
surface chemistry
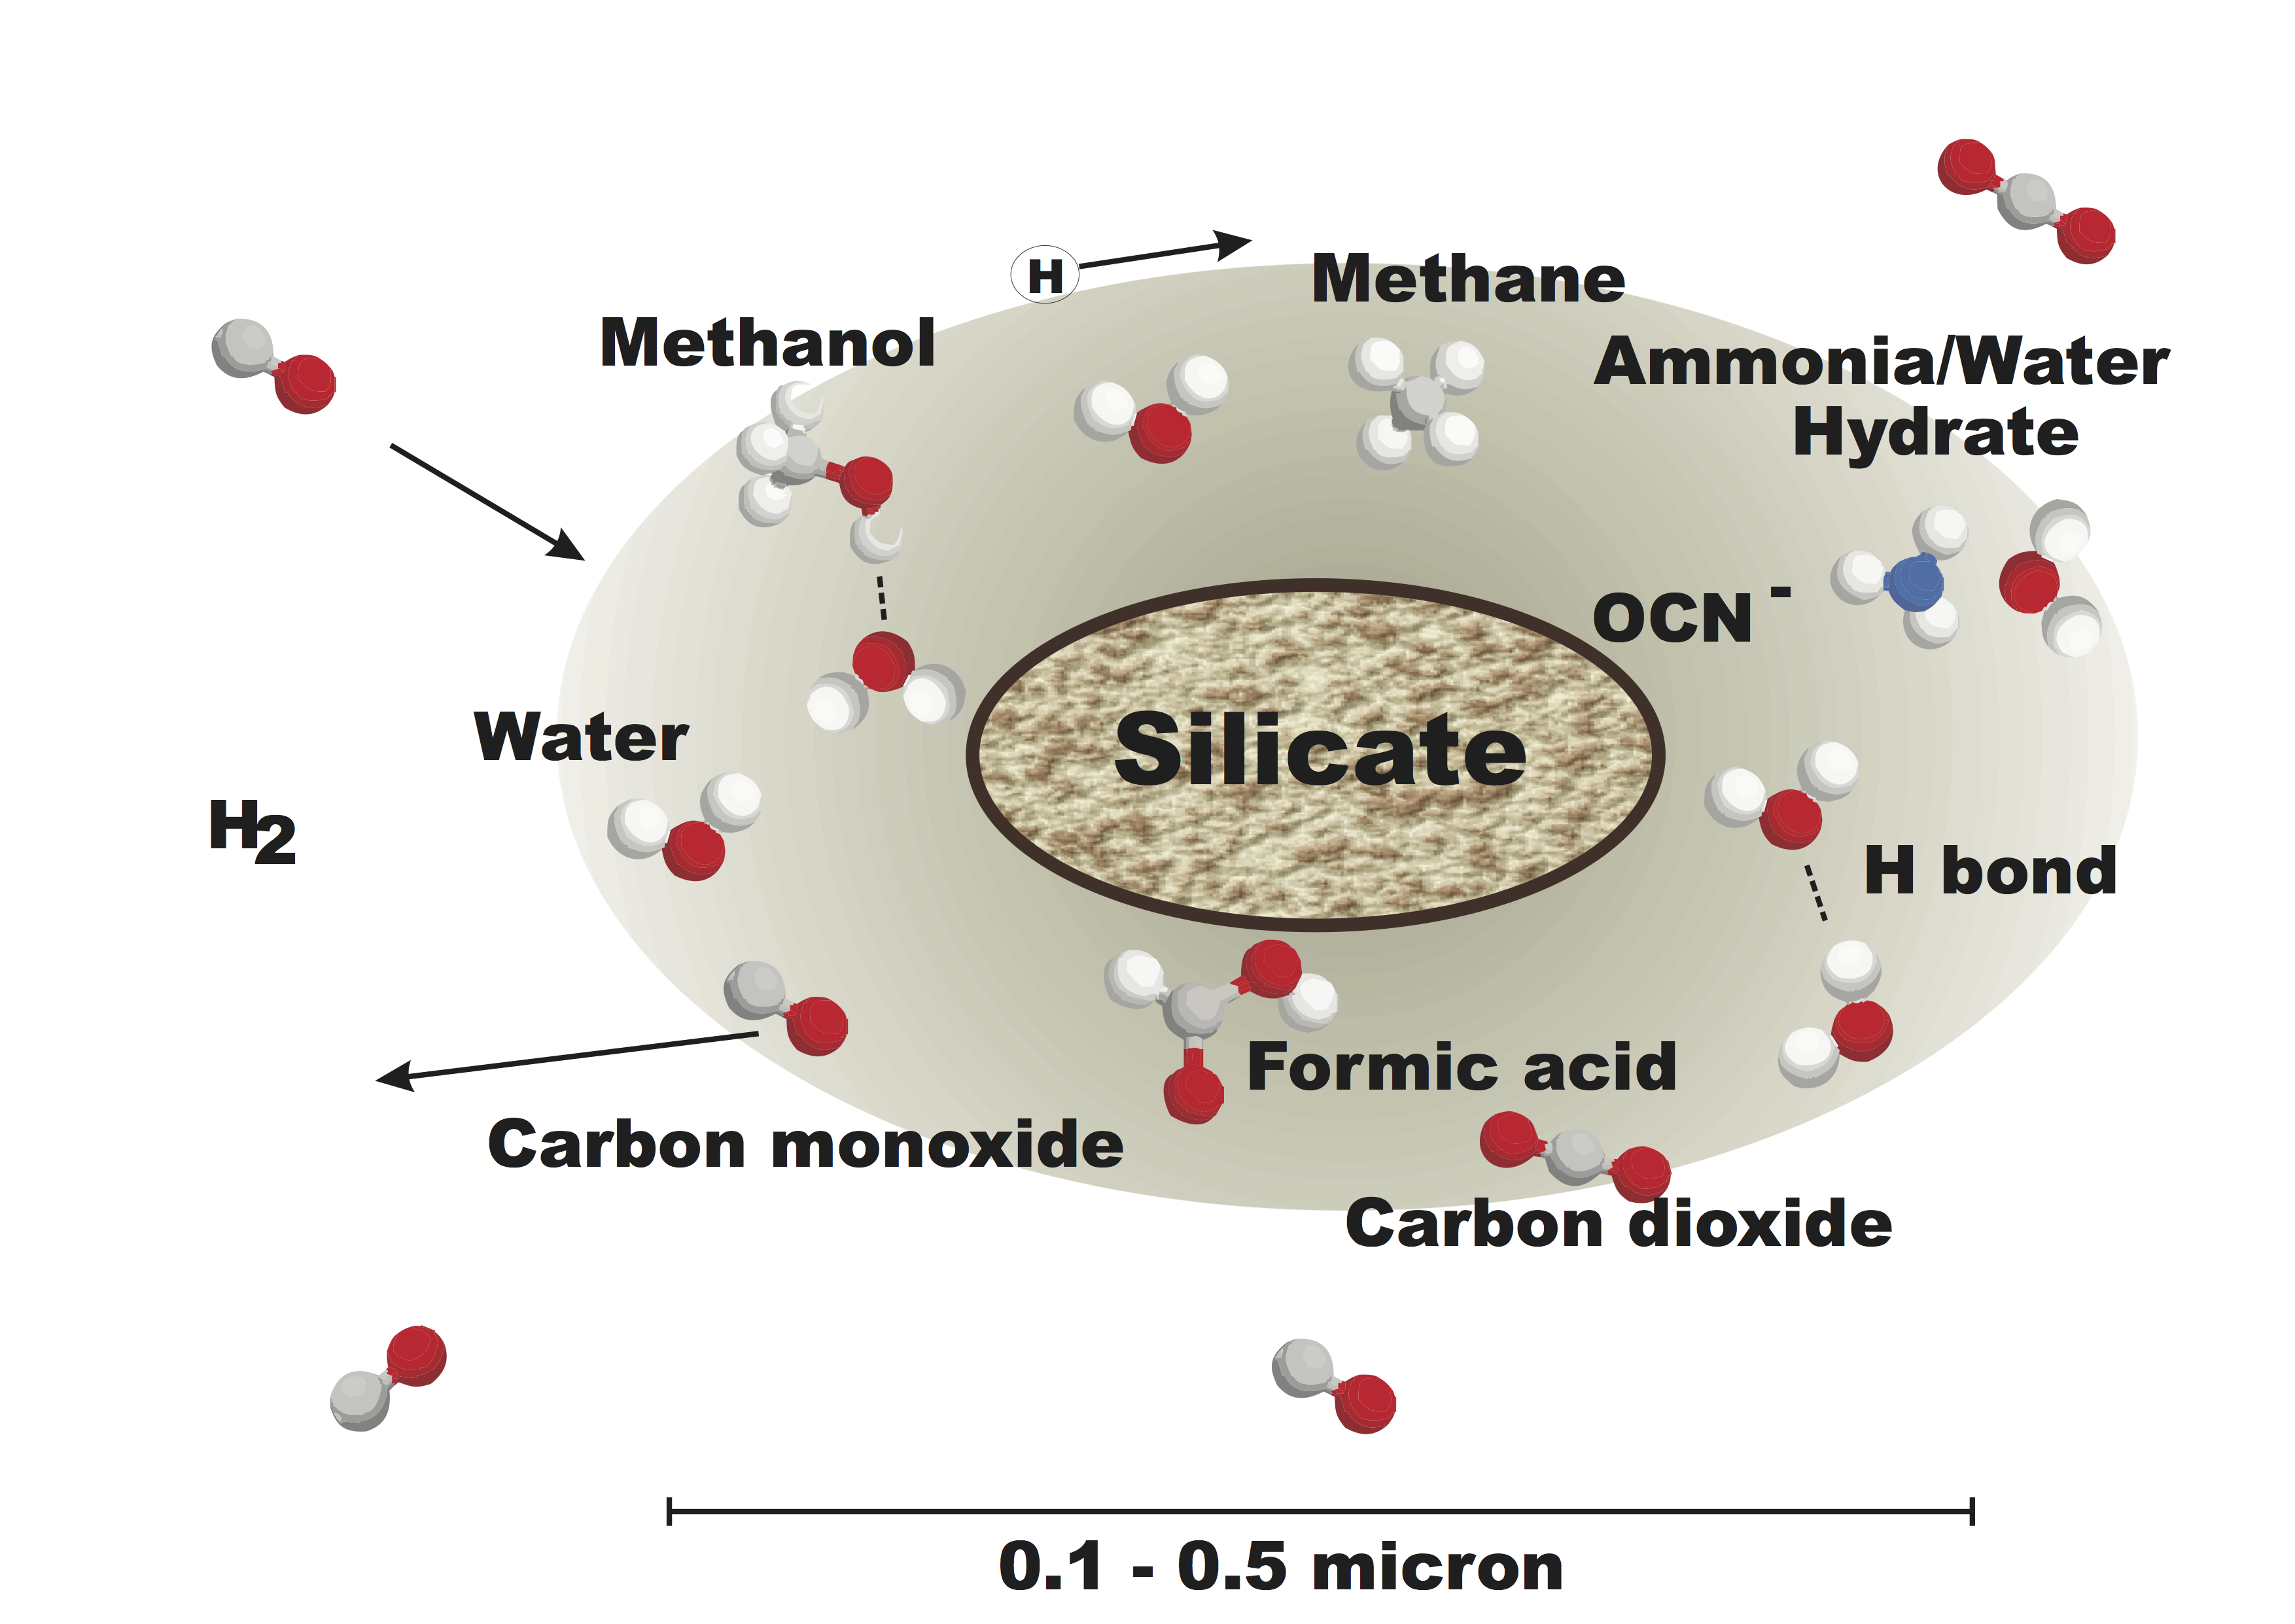
ProDiMo is now able to take into account surface chemical process...
Read more
phyllosilicates
phyllosilicates
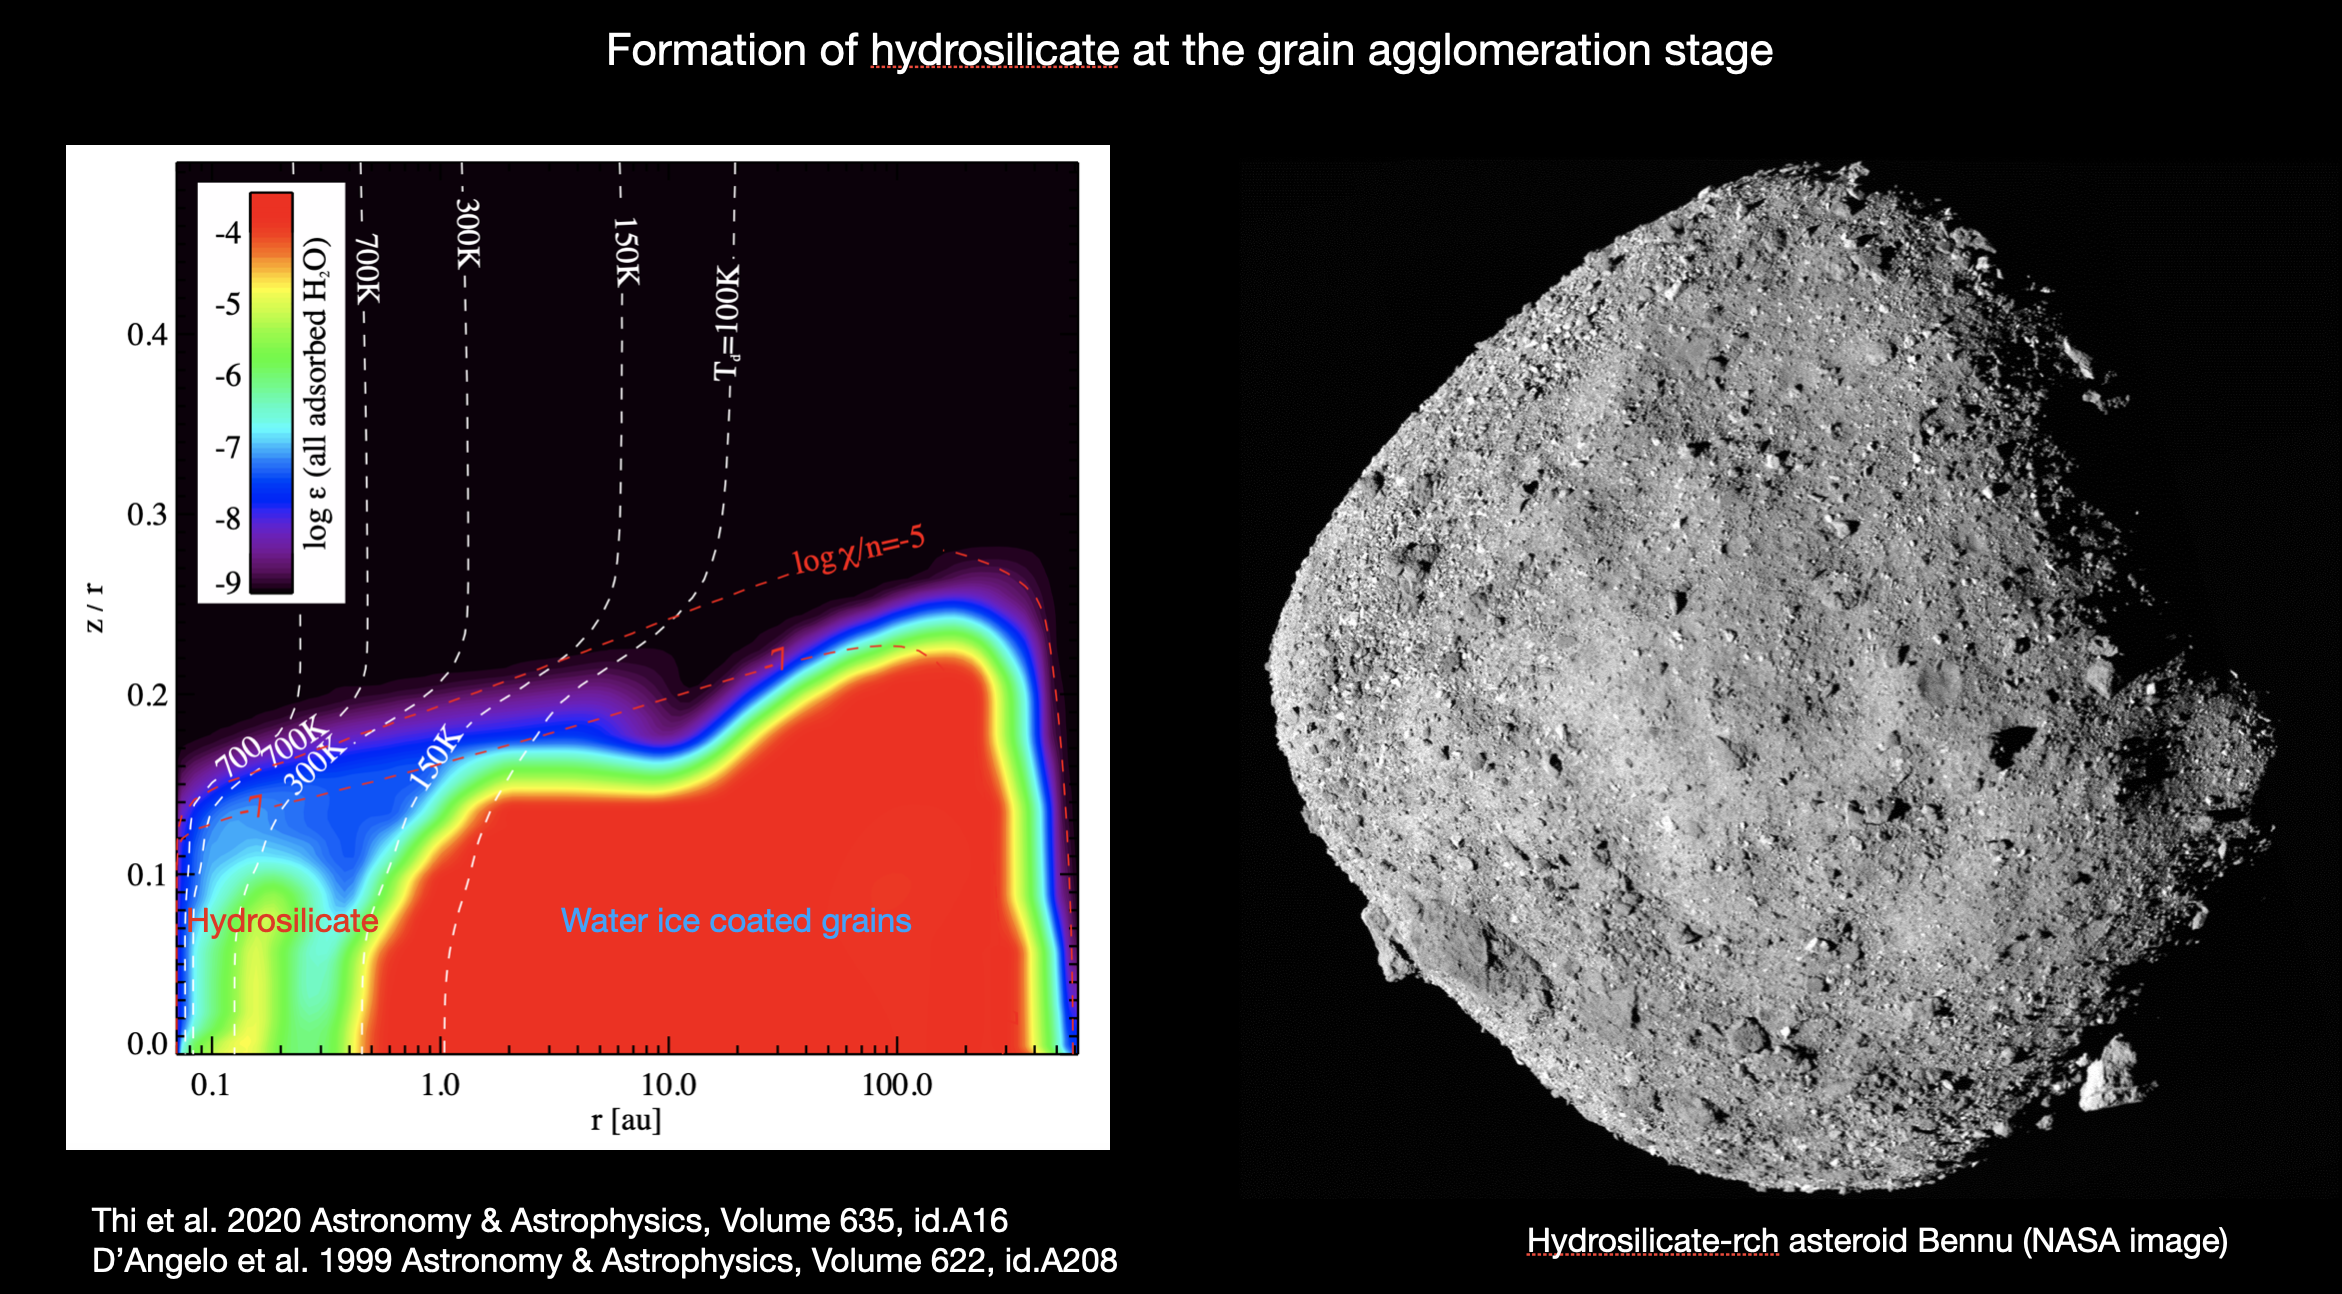
The hydration of rocks can optionally be included as a time-depen...
Read more
Chemical rate networks
With ProDiMo you can use various standard chemical rate networks ...
Read more
IR molecular line emission spectra
ProDiMo allows you to generate mid-IR molecular emission line spe...
Read more
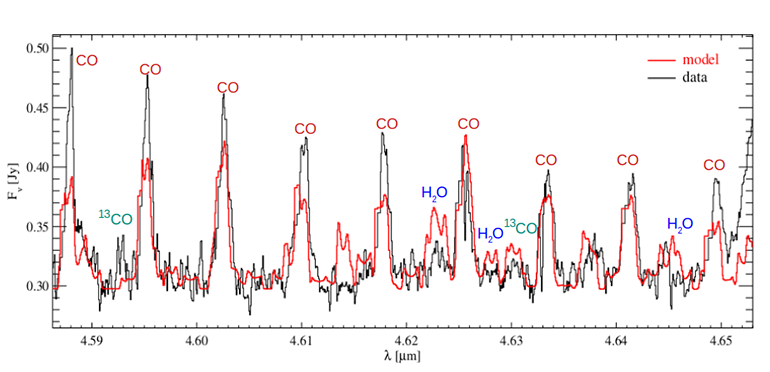
CO ro-vibrational emission lines
ProDiMo can predict high-resolution infrared line spectra emitted...
Read more
FU Ori outbursts
FU Ori outbursts
In FU Ori type outbursts, driven by episodic accretion, the stellar lu...
Read more

ProDiMo can predict high-resolution infrared line spectra emitted from the inner disk, including CO fundamental and overtones.  In case of CO, the user can specify the number of vibrational, rotational, and electronic states to be included into the non-LTE model, see (Thi+2013) for details.  The latter allows us to include the effects via fluorescent pumping. The example figure shows the CO fundamental spectrum for BP Tau (Woitke+2019, PASP 131, 4301). The strong CO lines appear asymmetric in the model because of underlying H2O lines.